anden.at
Discover the Andes


Society and economy
by Thomas Lohr


It is often problematic to make generalized statements on the society of a given country and, on this basis, to draw conclusions on the real situation of the people. Certain indicators, however, allow us to compare different countries and regions, but also to highlight temporal trends. A useful tool to do so is Gapminder. Employing this interactive framework, we will now compare selected socio-economic indicators for Chile and Argentina to those for Austria and other countries. This will enable us to highlight similarities and differences beween these two countries, and to compare the situation there with our own socio-economic environments.

Life expectancy and birth rate
First, let us consider life expectancy and the birth rate per woman. These two indicators allow us to draw some conclusions on the age structure evolving in a society in a given country or region. According to the model of demographic change, the mortality rate first decreases due to the progress in medicine with increasing level of development. After some time, the socio-economic conditions lead to a decrease of the birth rate, as it is shown in this graphics.
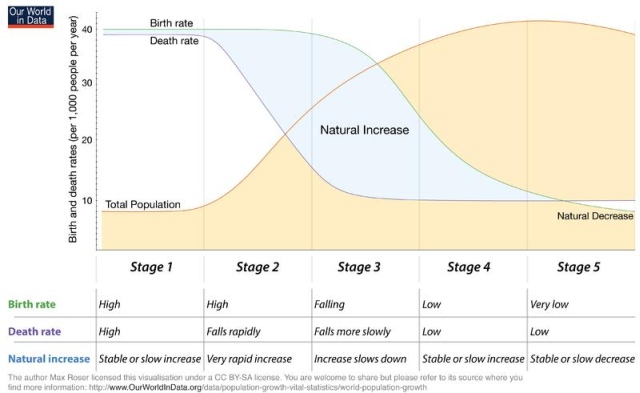
Graphics: Max Roser (Our World in Data)
Can these ideal types also be confirmed for Austria, Chile, and Argentina? What are your observations with regard to the development in the individual countries?
The Gapminder Tools help you to visulize socio-economic indicators of the individual countries. You can display the desired indicators on the x- and the y-axis.
- In all of the countries under investigation, the birth rates and mortality rates decrease more or less at the same time. This indicates that the records start at the beginning of Phase 3.
- Whereas the life expectancy is largely similar in all three countries around 1900, also the birth rate decreases in Austria. In Chile and Argentina it is still high.
- The following trend shows a decrease in the birth rates in all three countries. The life expectancy increases, whereby Chile and Argentina lag behind Austria.
- The world wars are clearly recognizable in the indicator values especially for Austria.
- The economic boom after World War II is particularly reflected in the birth rate in Austria.
- In the early 1980s, the birth rates in Chile and Argentina are still twice as high as in Austria.
- In 2018, Chile and Austria show quite similar values of the indicators, whereas Argentina has a lower life expectancy and a higher birth rate.

The Gini Coefficient over time
The Gini Coefficient serves as an important indicator of the distribution of certain values. It is most commonly used to describe the distribution of income in a given country. Thereby, a value of 1 corresponds to complete inequality, whereas a value of 0 corresponds to complete equality.
Compare the evolution of the Gini Coefficients of the selected countries.
The economic crisis in Argentina
In 2001, the economy of Argentina once more fell into a severe crisis. The economic performance of the country declined considerably, whereas the neighbouring country Chile was not affected by the crisis. There were currency depreciations, decreased spending power, and an increase of the costs of daily life, as well as cuts of social services. The reasons for the crisis were the strongly increasing national debt, capital flight, and an overvaluation of the Argentine Peso. Whereas the share of income of the lowest 10 percent declined drastically during the crisis, the share of income of the upper 10 percent even increased.
Click on the arrows to switch between different indicators.


This contribution was revised, extended, and translated from German by Martin Mergili.